Froogal

Industry
SaaS · CRM · Sales Intelligence
Product Experience Transformation
Engagement
Market/Reach
B2B · Sales & Operations Teams
Strategic Direction
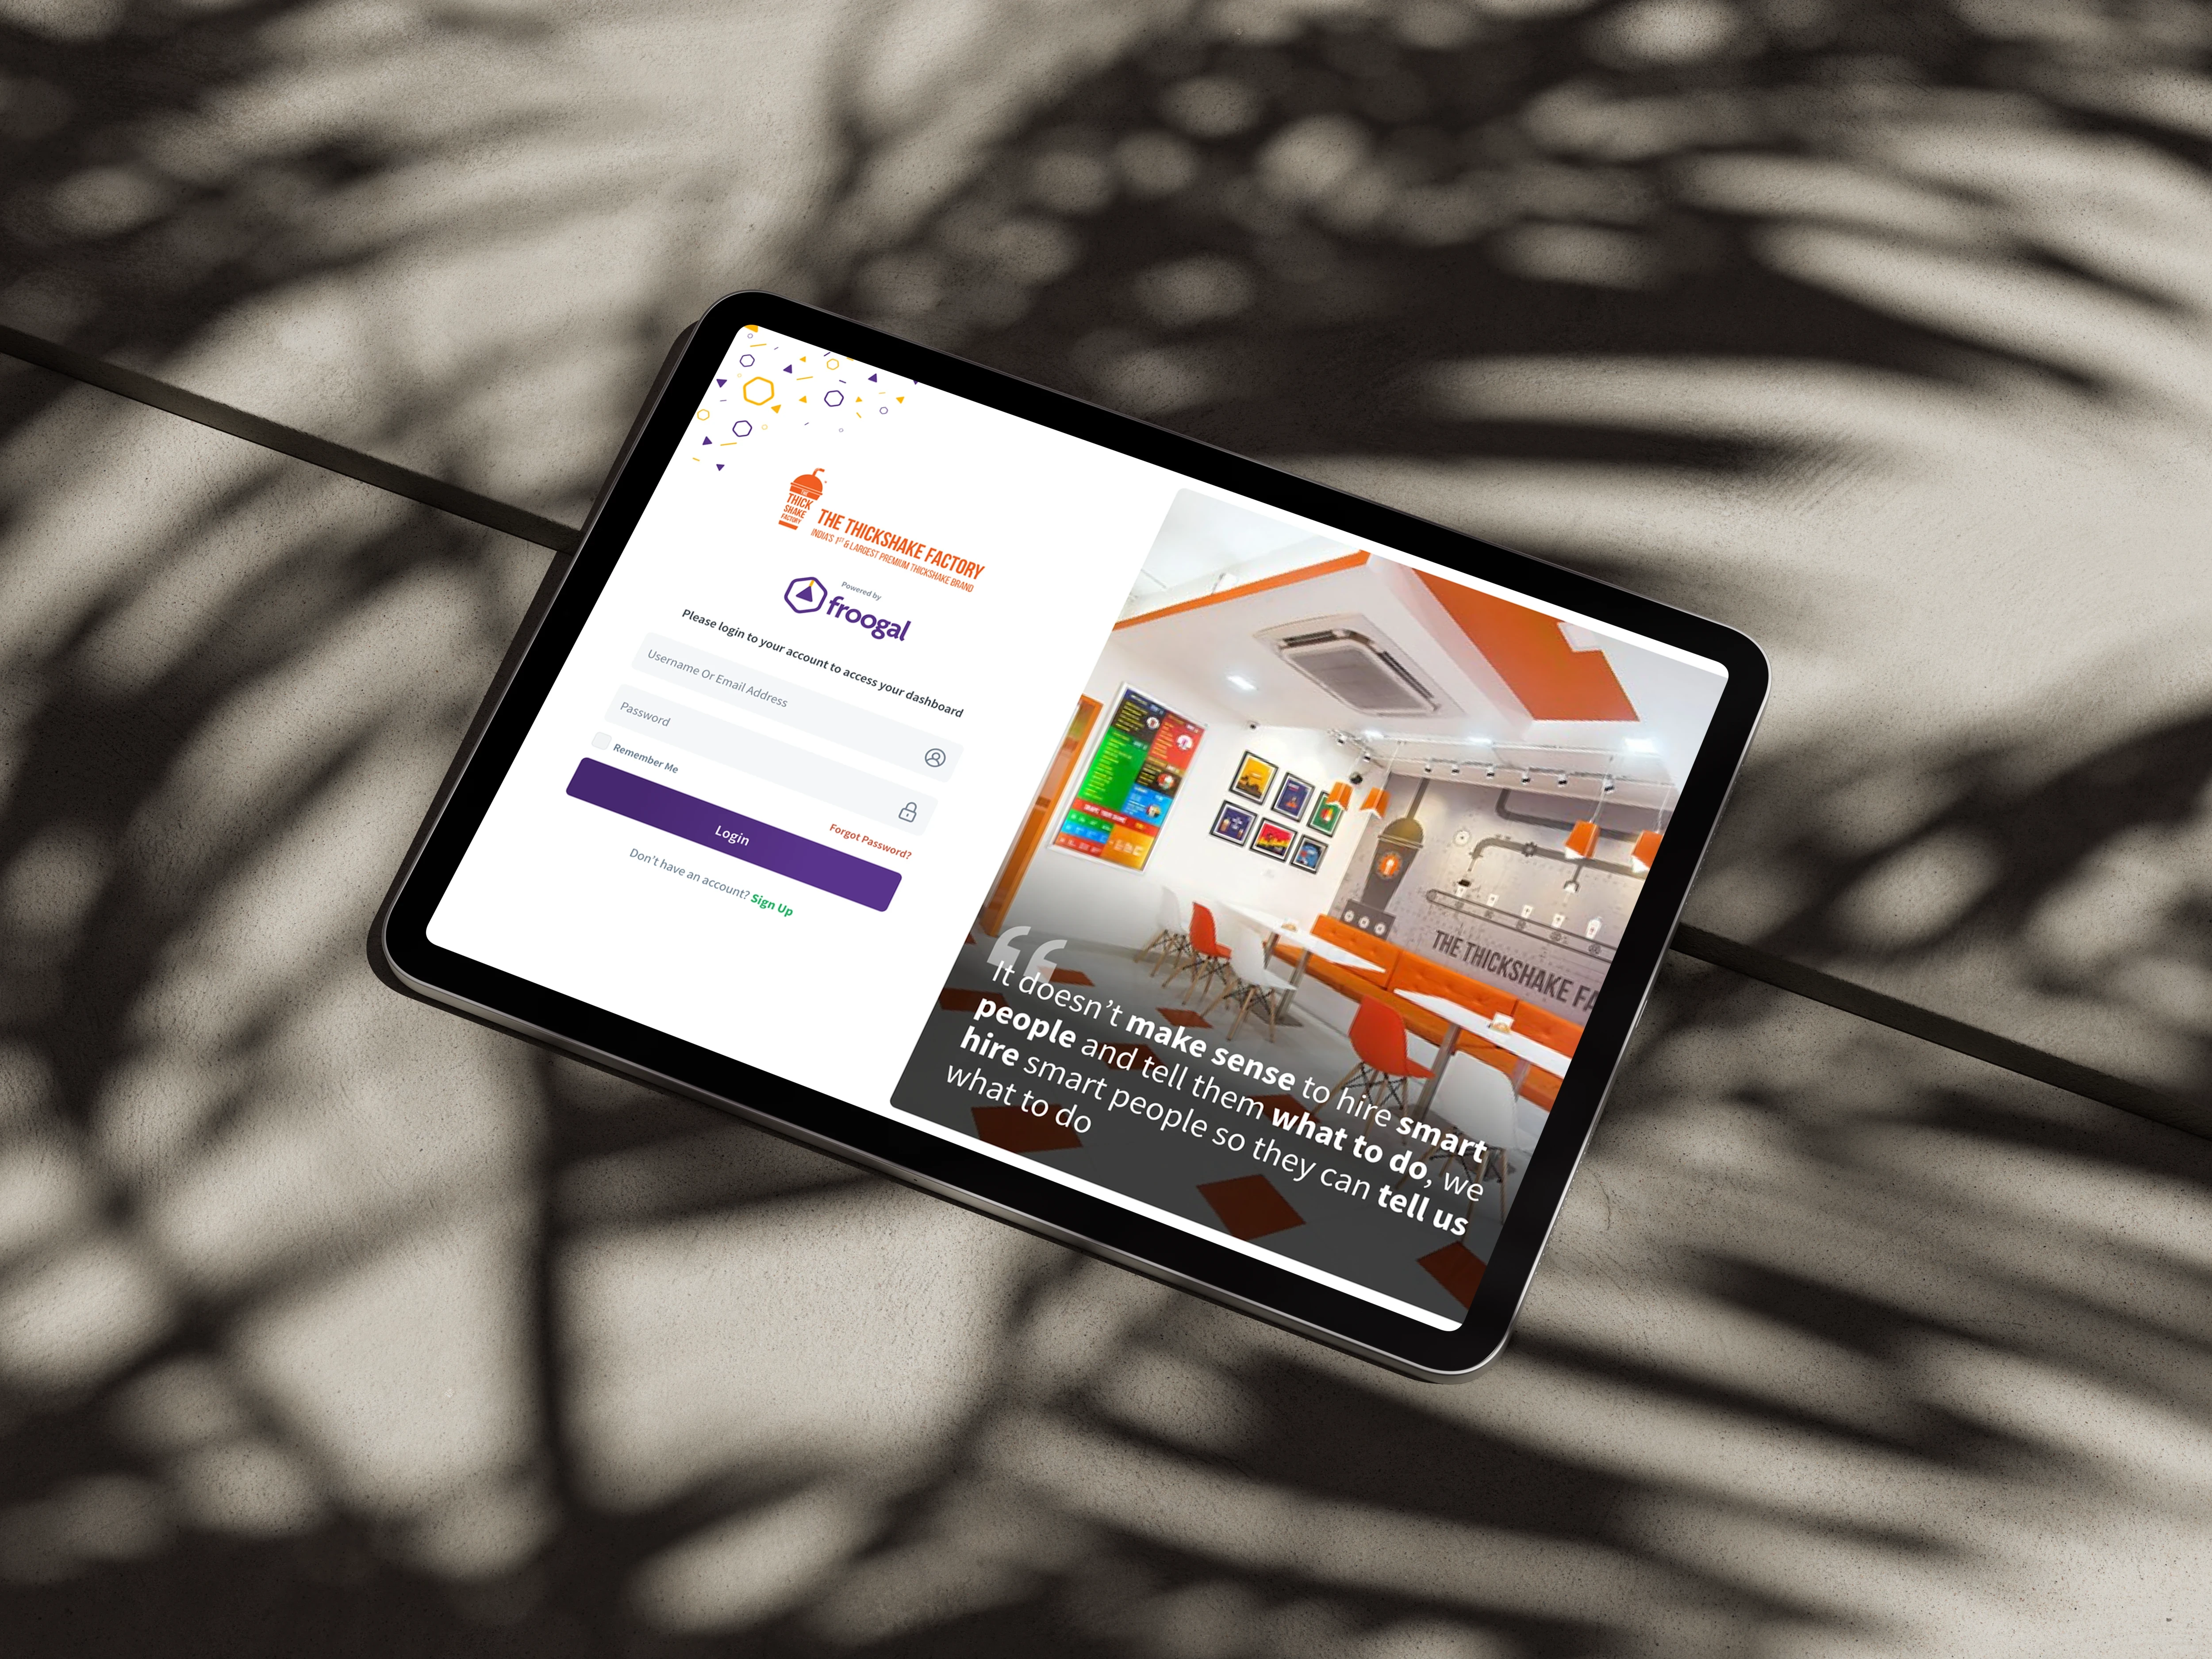
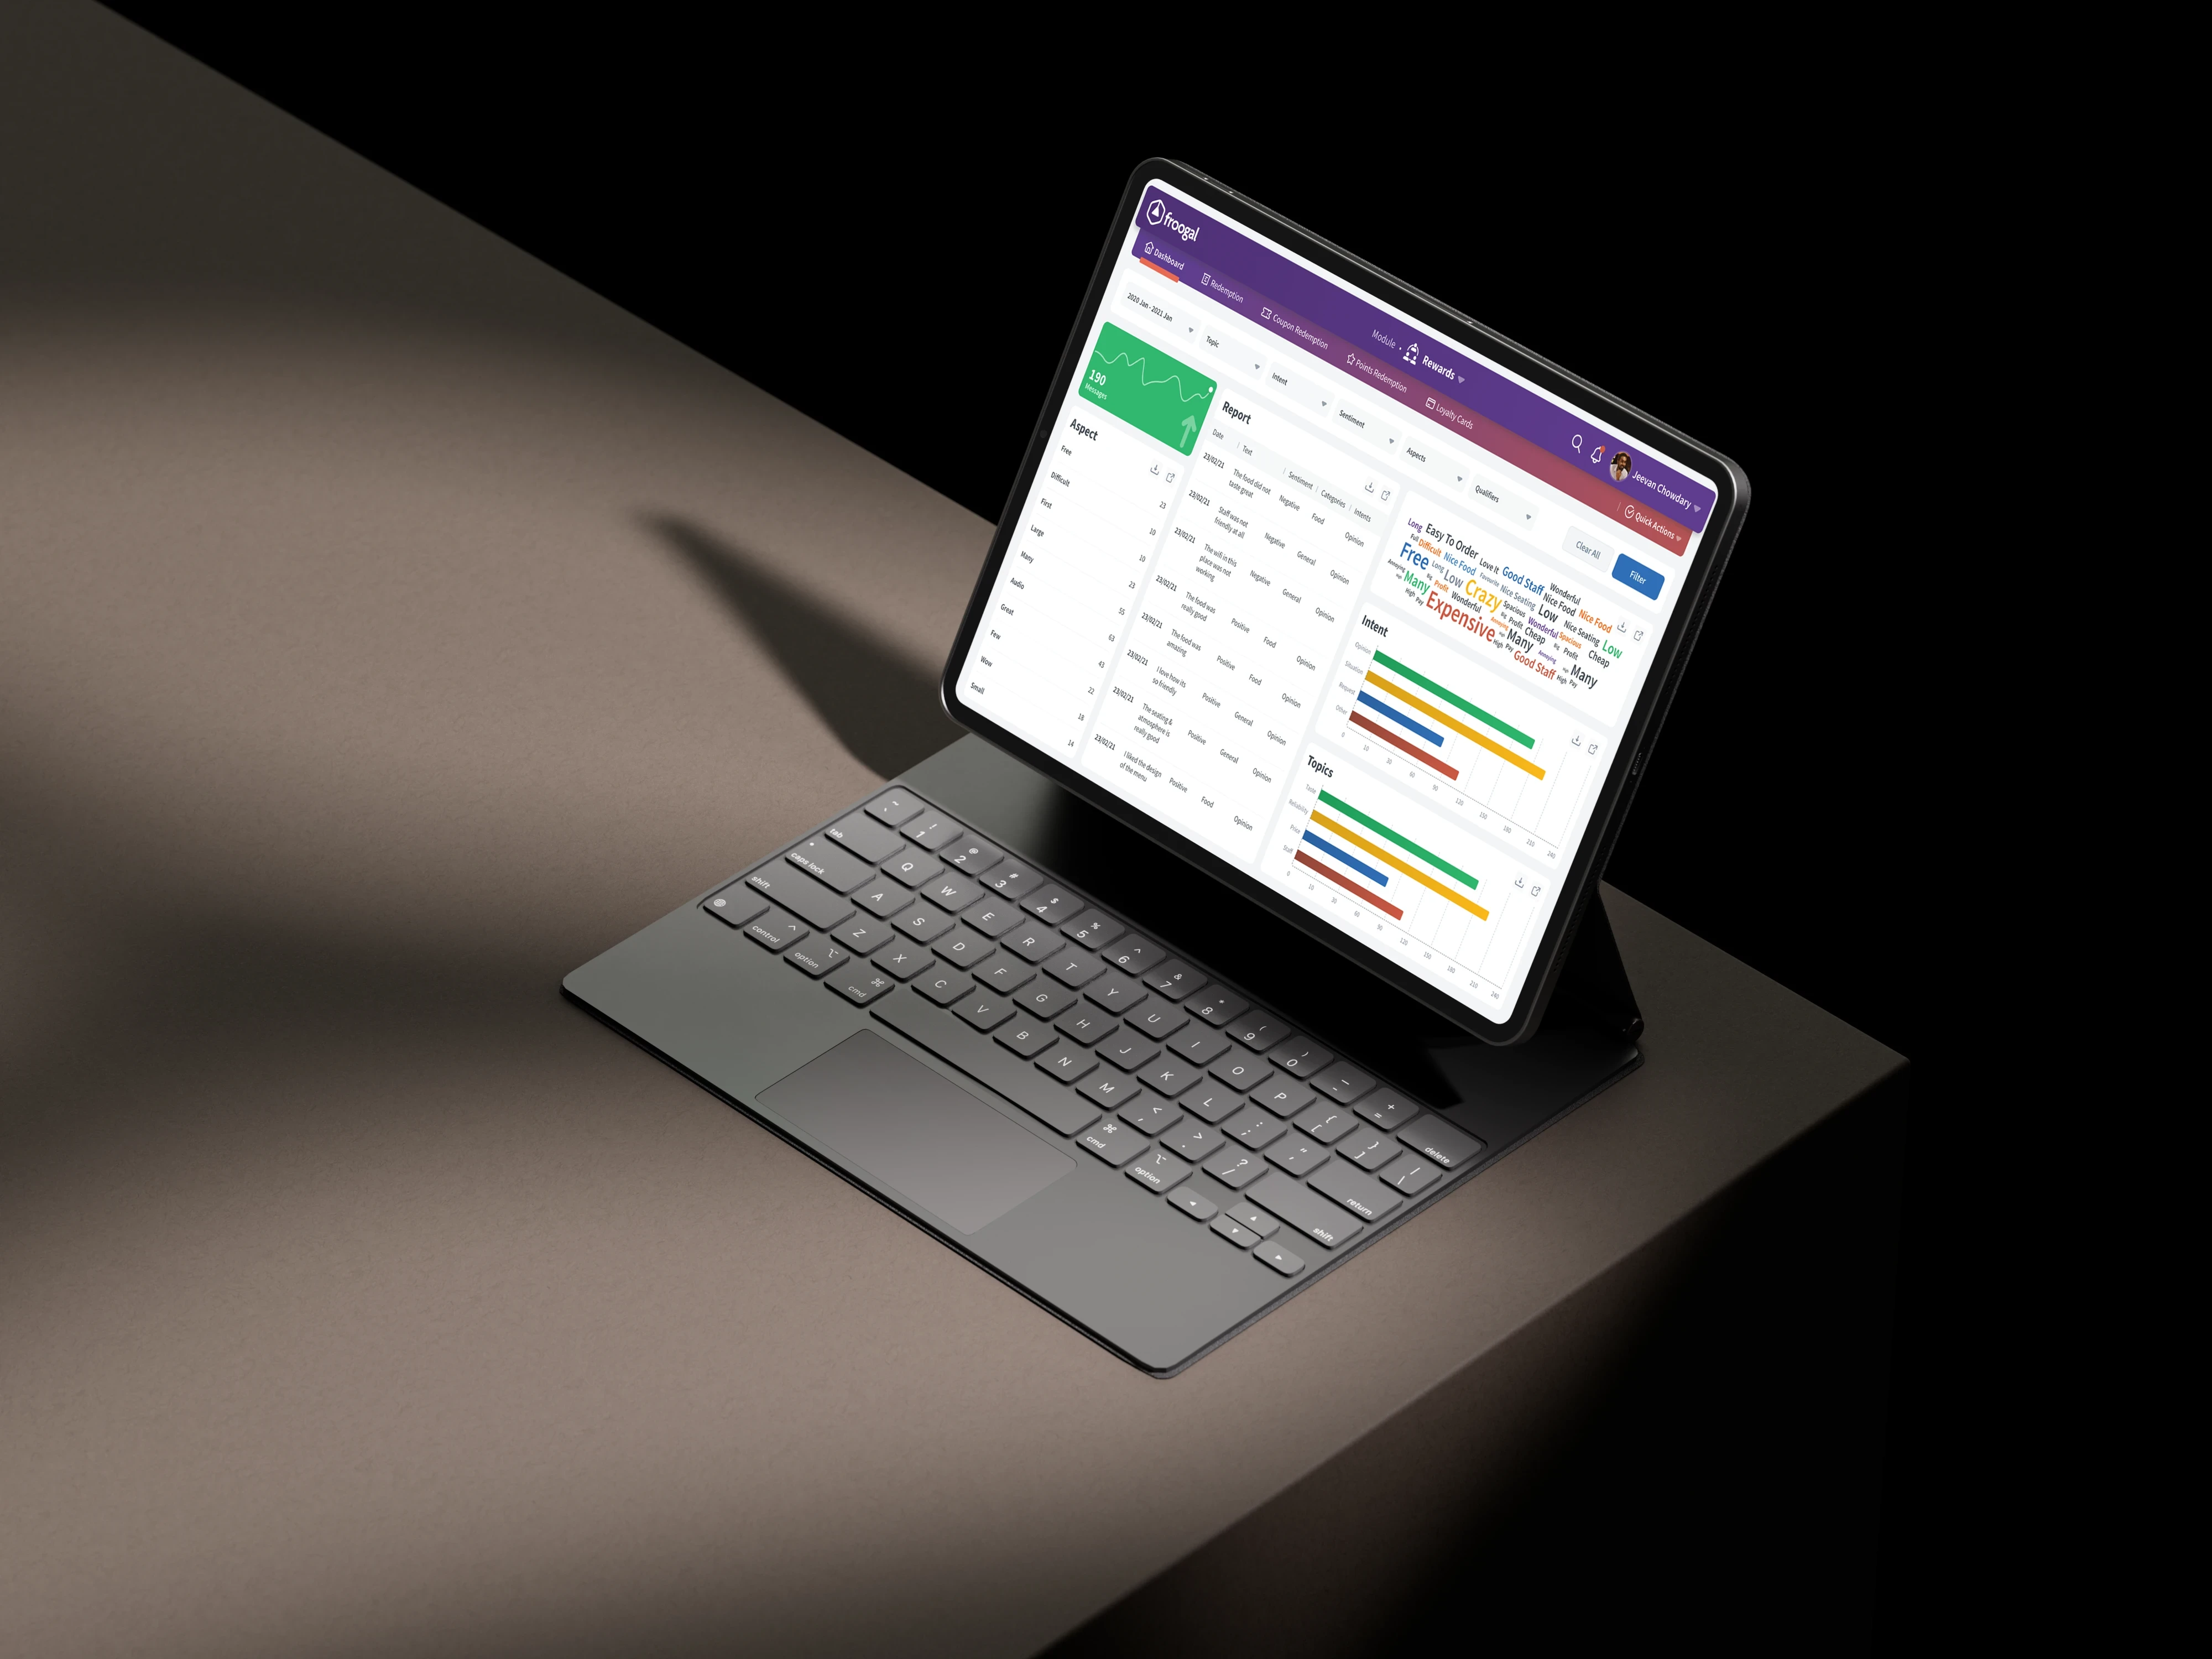
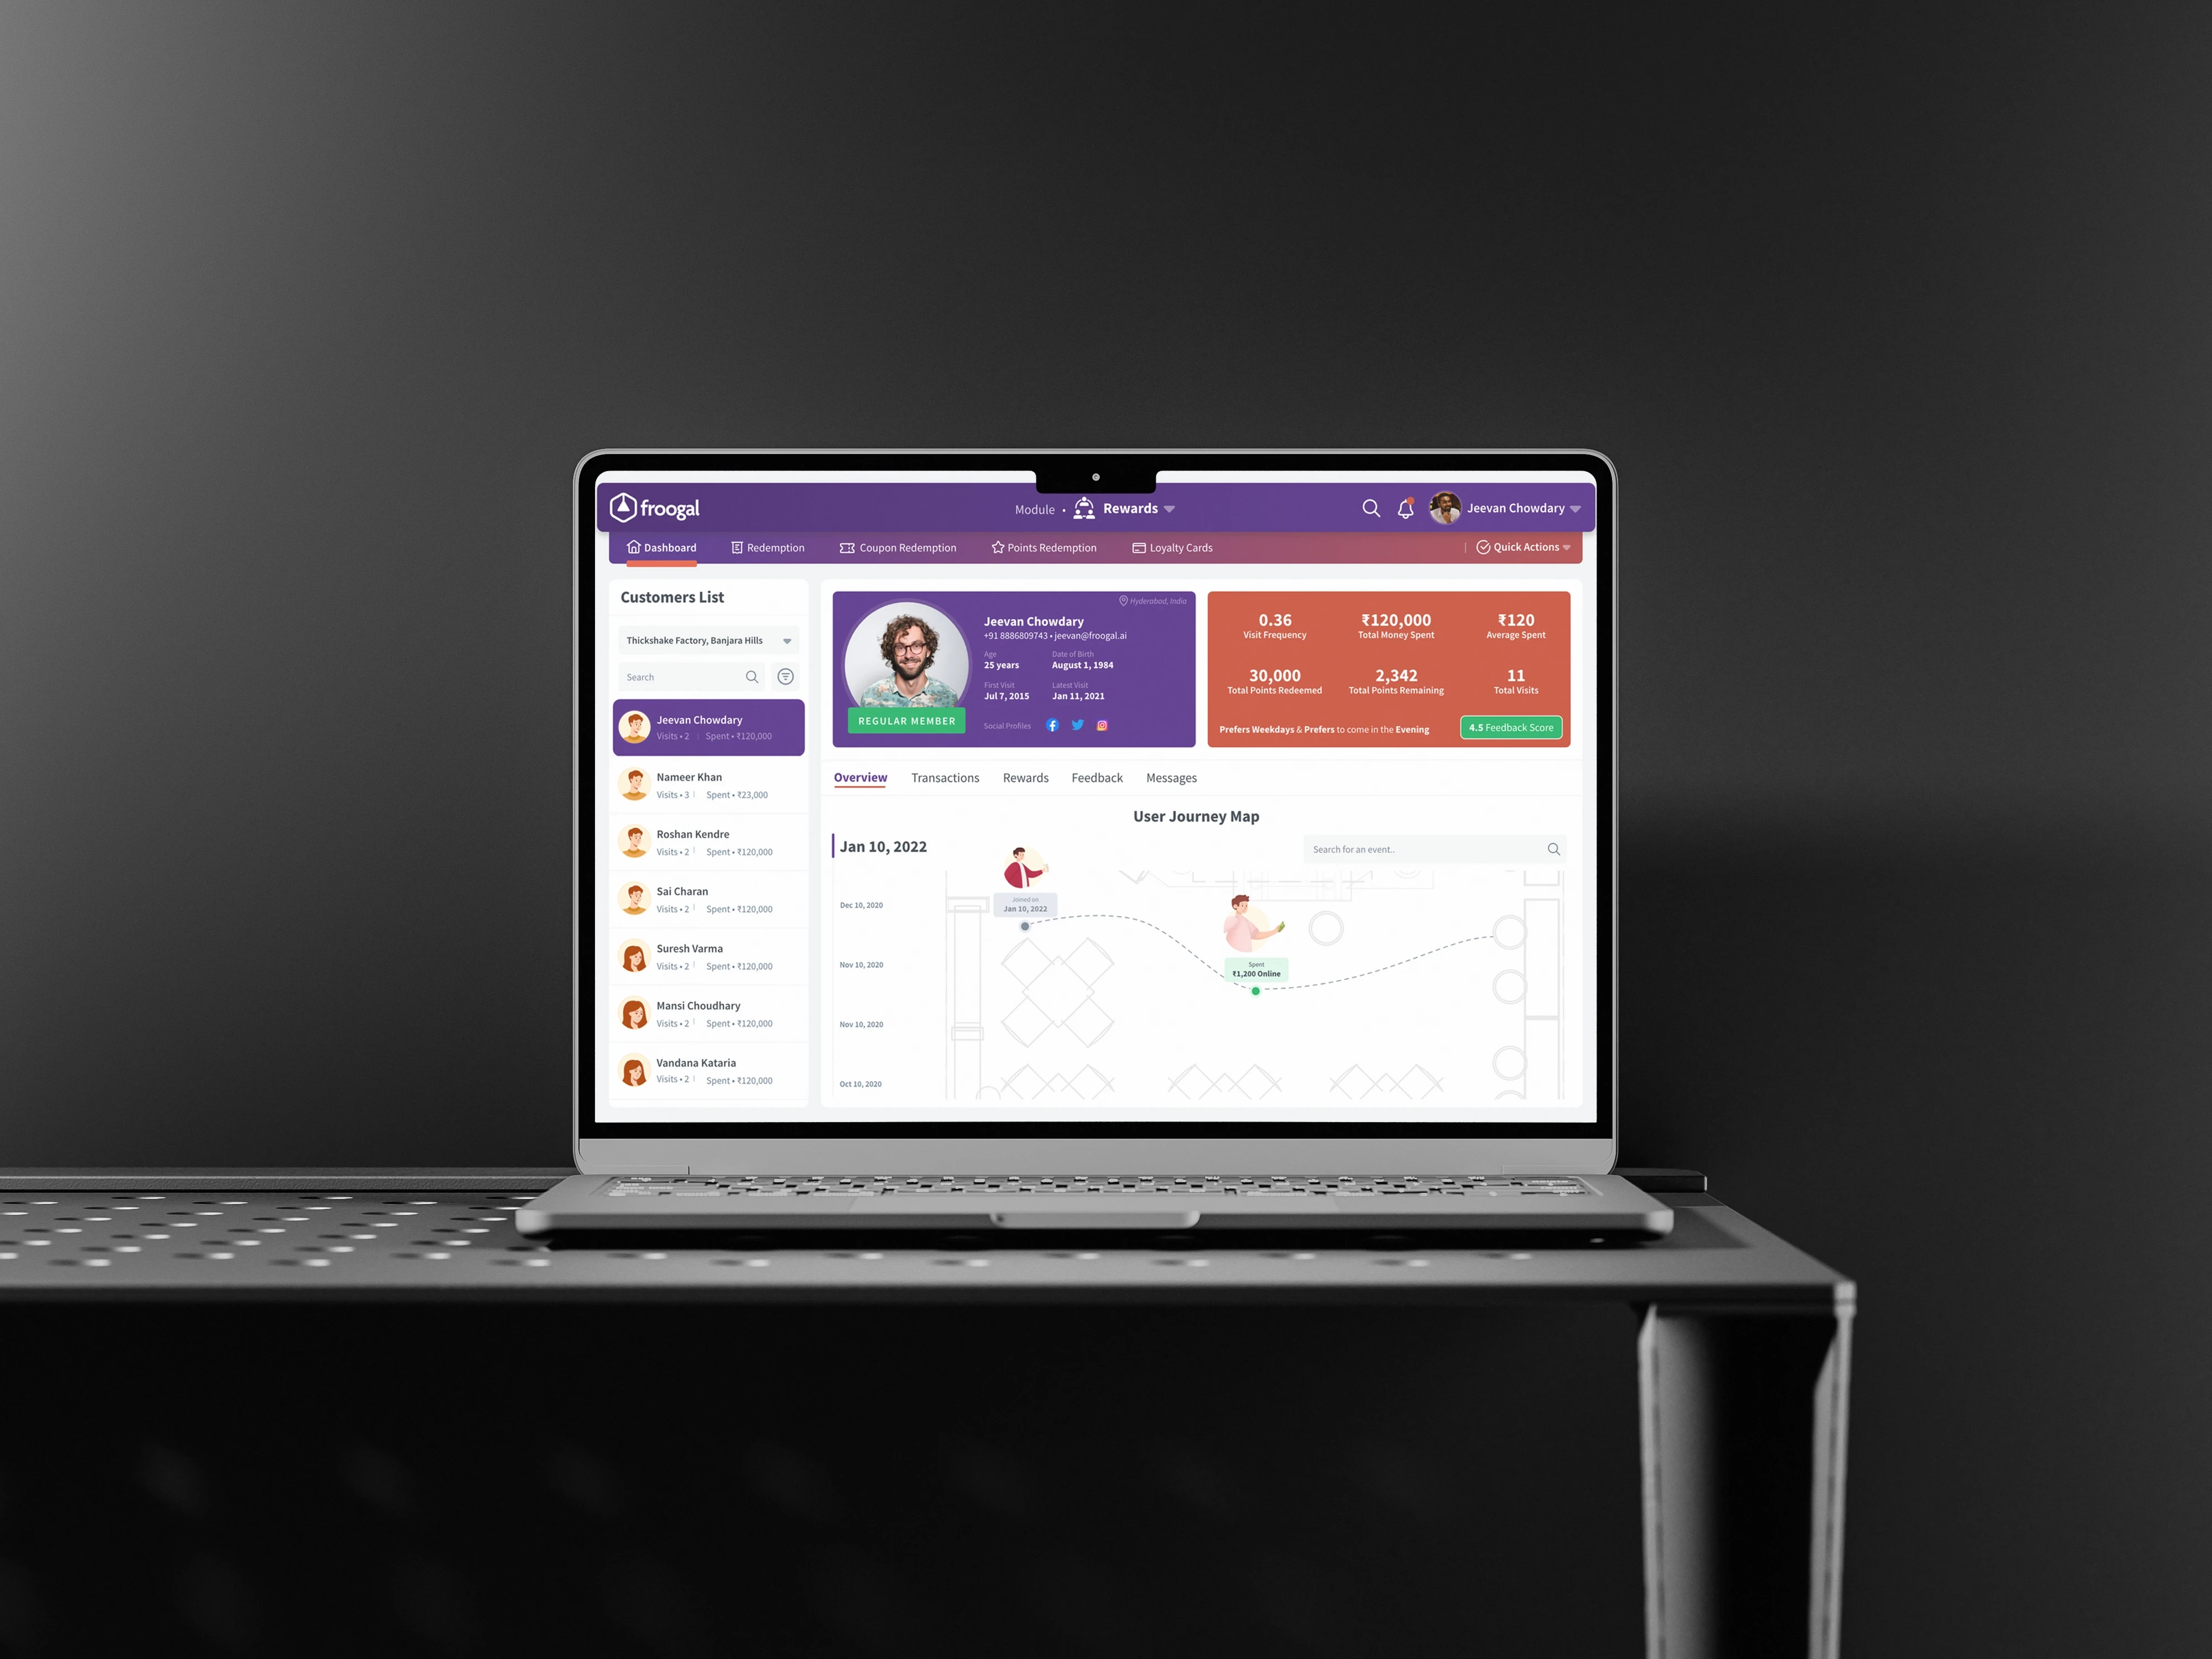
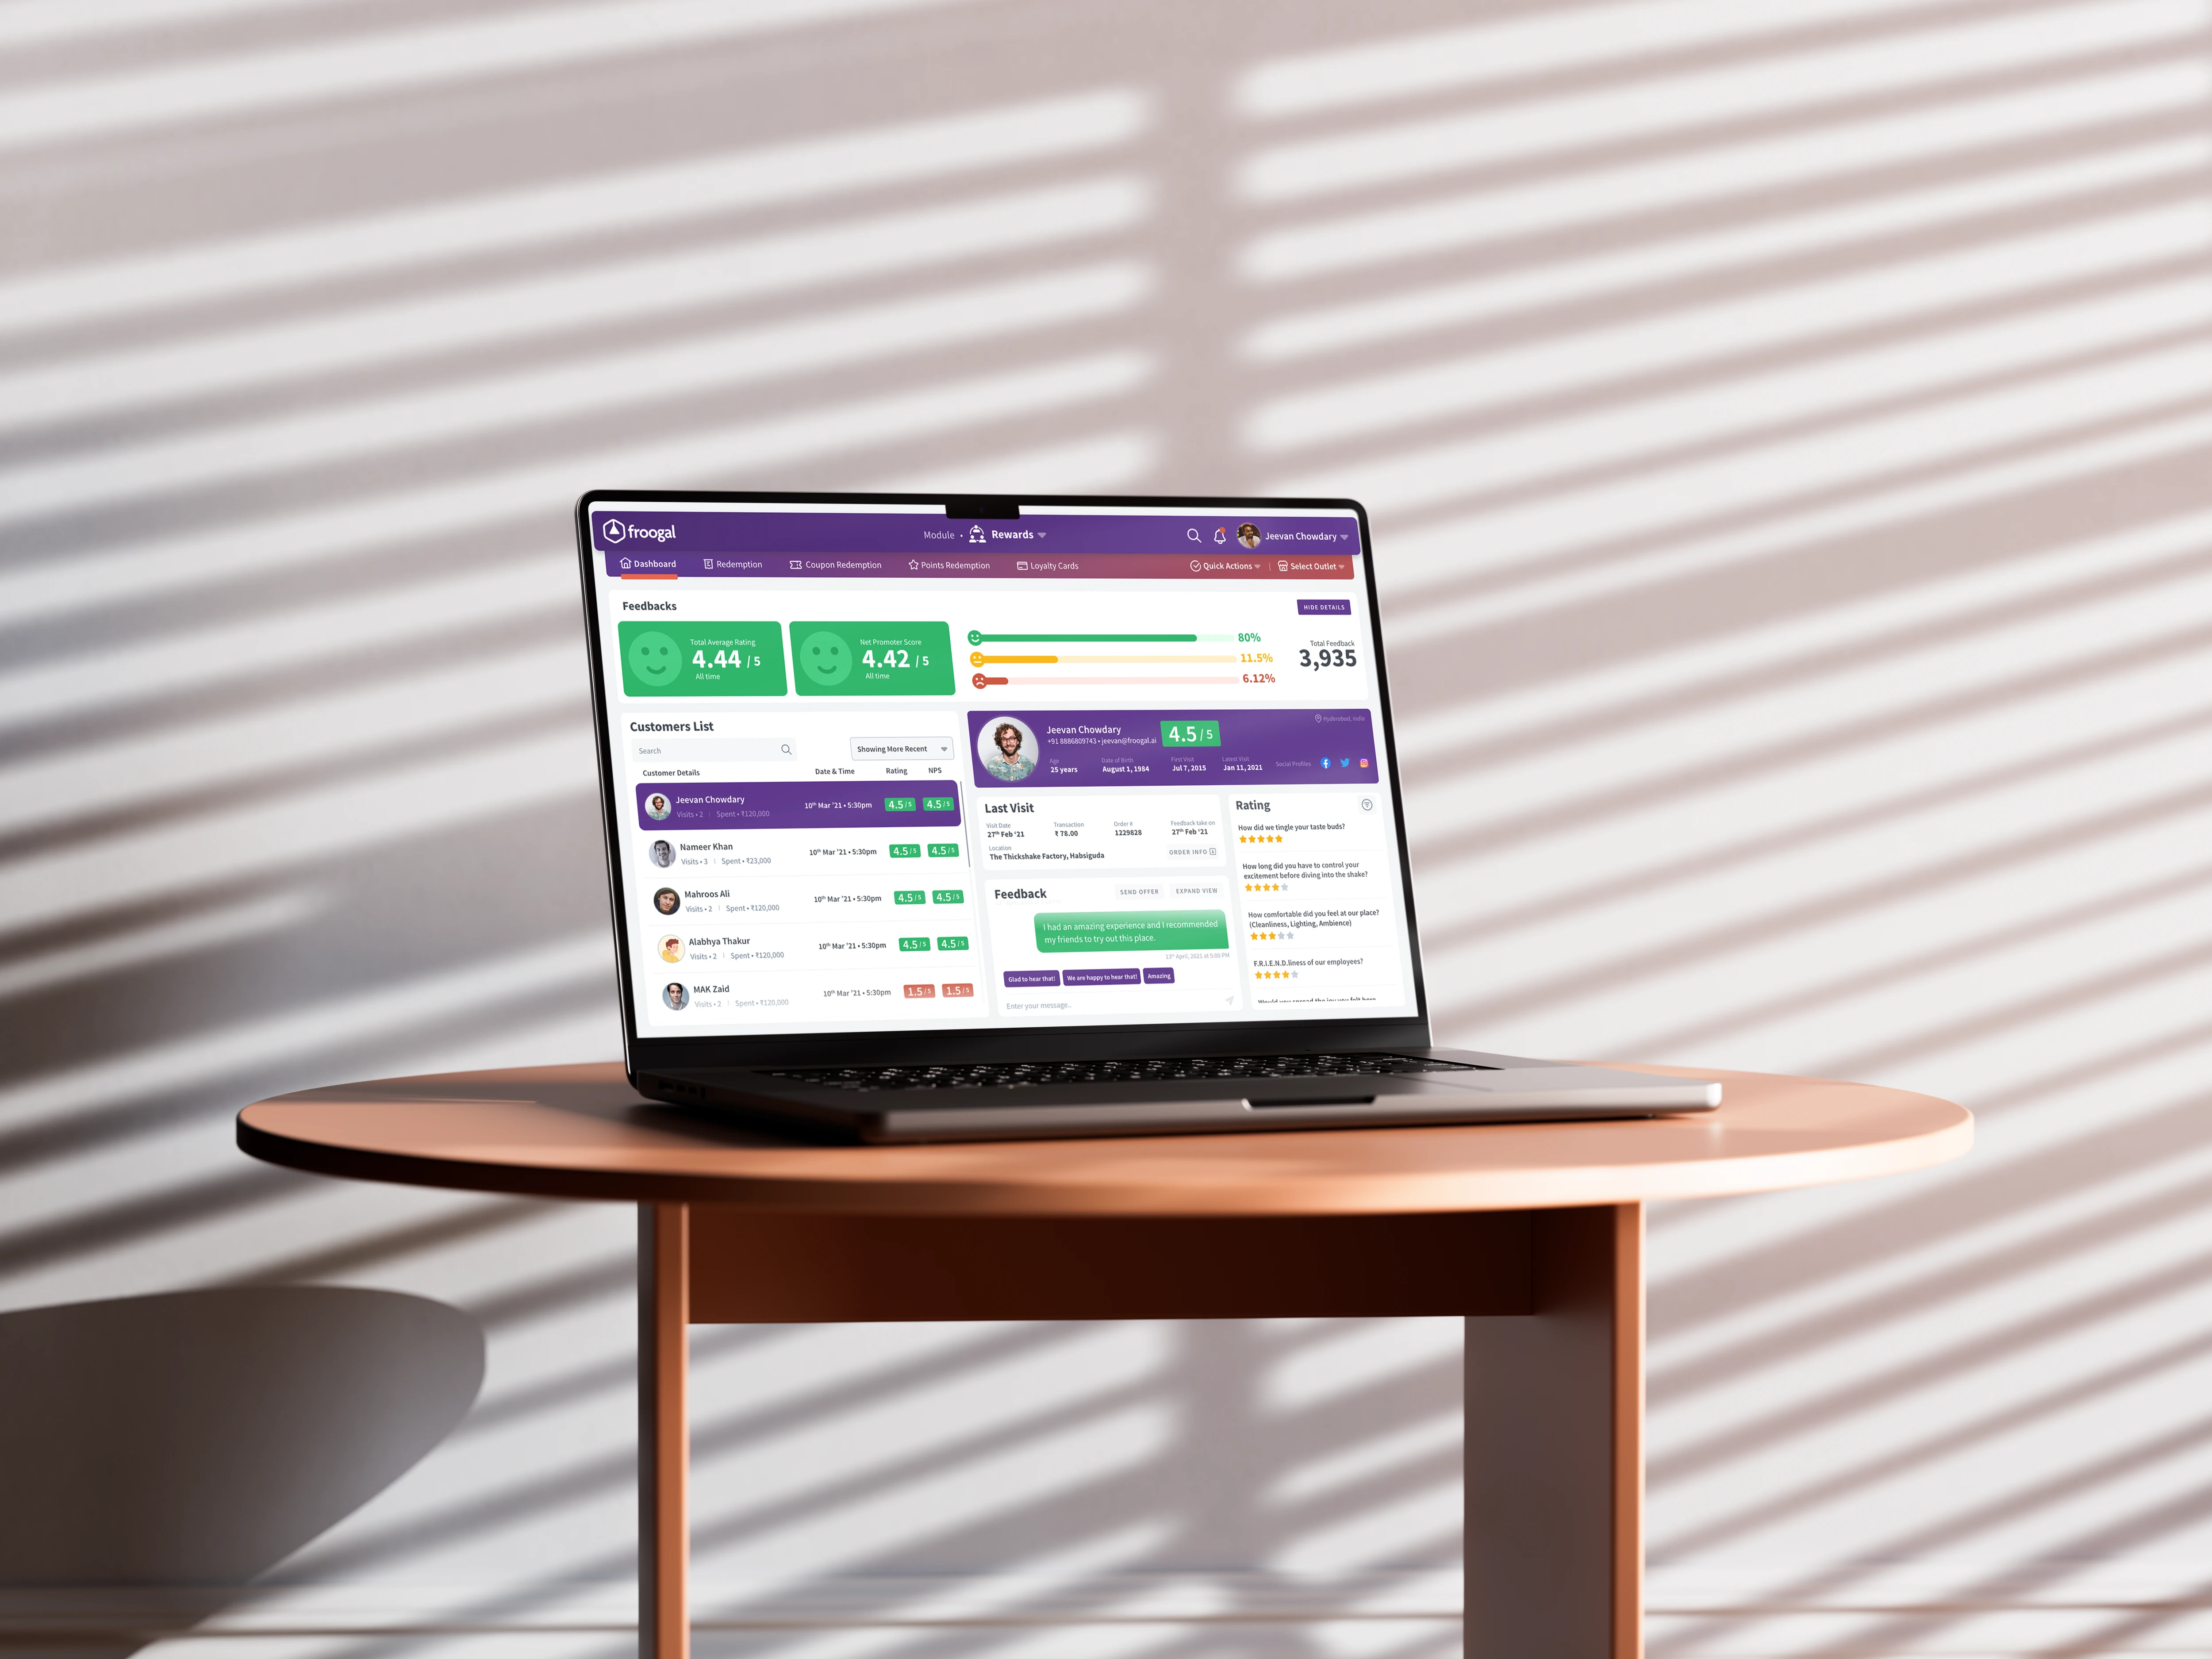
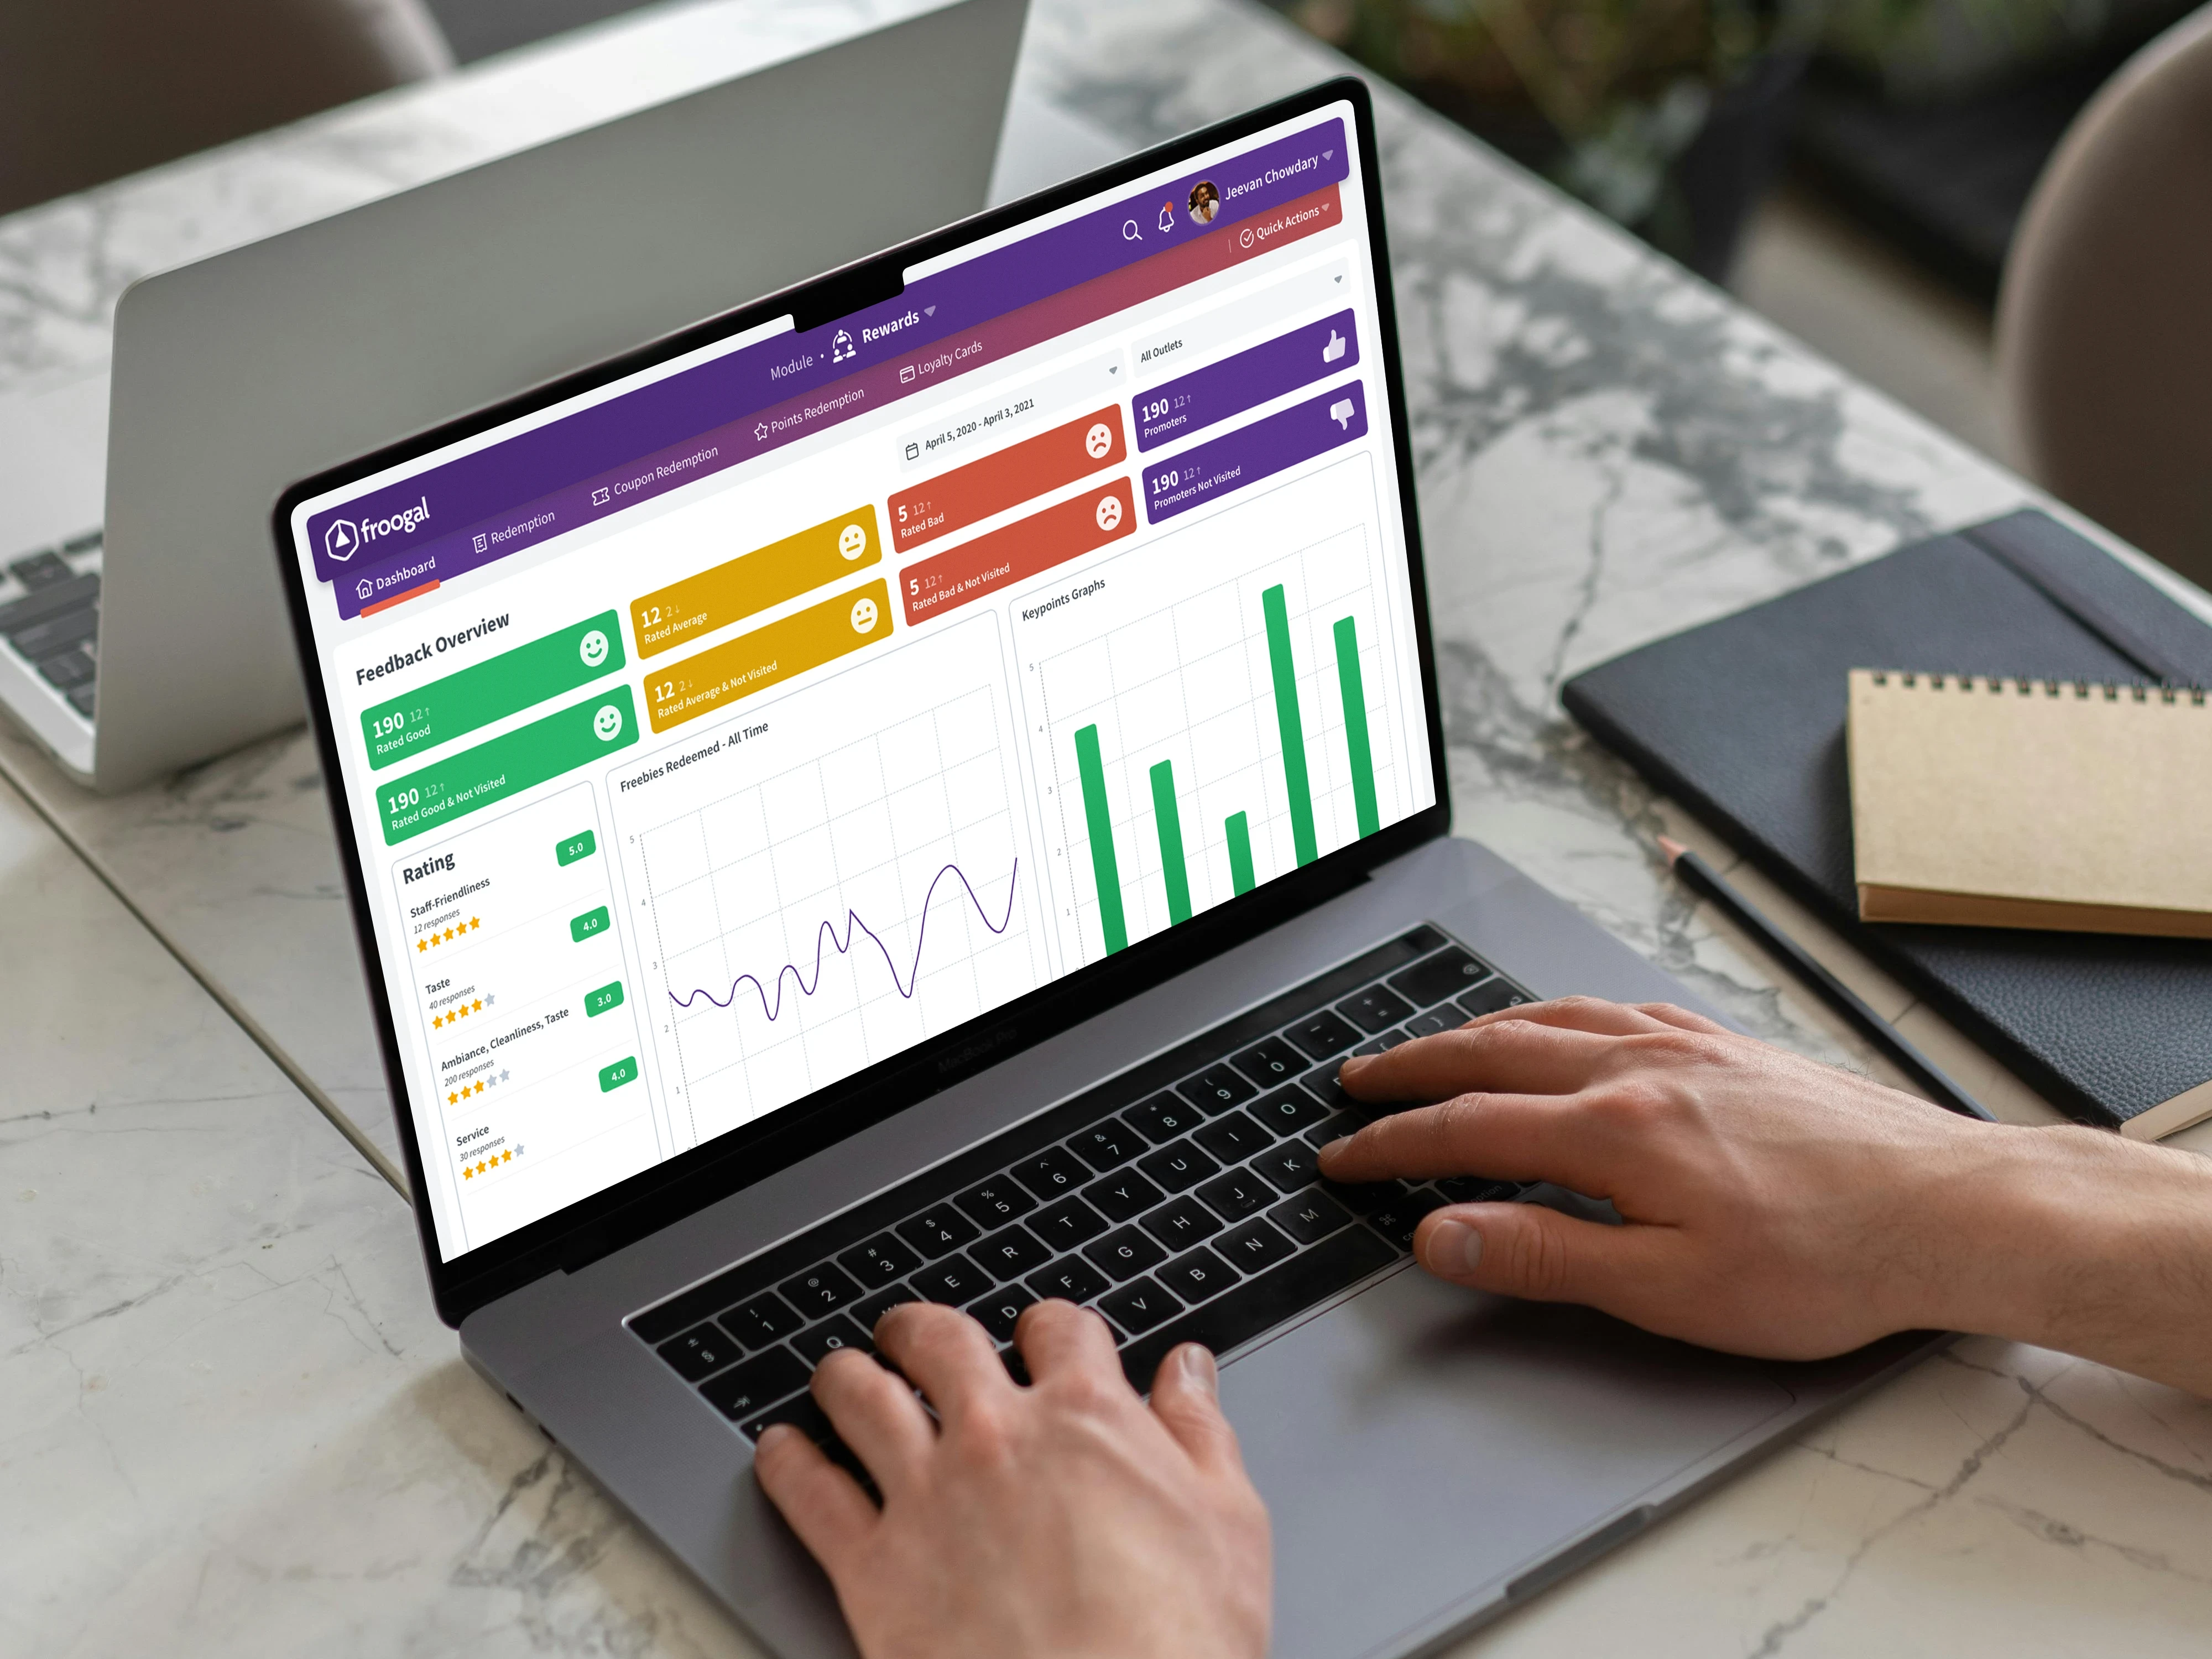
Delivered as part of a broader enterprise engagement within the Noor Inc team, this project focused on designing a high-performance CRM dashboard experience for Froogal. The strategy centered on transforming fragmented sales data into an intuitive command center through clear information hierarchy, dynamic visualizations, and action-oriented navigation systems. The interface was built to empower business teams to monitor performance, identify trends, and make faster data-driven decisions.
Scope Of Work
UX Strategy
Dashboard Information Architecture
Data Visualization Systems
Interaction Design
KPI Interface Design
Custom Widget Framework
Navigation Optimization
User Testing & Iteration
The Challenge
Data Visibility: Sales teams needed a centralized dashboard experience that simplified access to KPIs, pipeline health, and performance metrics.
Decision Speed: Existing workflows required clearer data visualization and intuitive navigation to support faster business decisions.
Usability & Adoption: The platform needed a more dynamic and interactive interface to improve day-to-day usability and encourage consistent product engagement across teams.
Impact
Improved decision-making speed across sales workflows
Enhanced visibility into performance and growth metrics
Reduced friction in accessing critical CRM insights
Strengthened daily platform adoption across teams
Enabled faster identification of sales opportunities and risks
Outcome
A dynamic, insight-led CRM dashboard that transformed complex sales data into actionable business intelligence, enabling teams to make faster decisions and drive measurable growth.
Key Achievements
+52% faster KPI visibility and decision access
+34% stronger daily dashboard engagement
+26% lower task completion time
Interactive custom data visualization system
Modular dashboard widget architecture
Enterprise-ready usability framework
Froogal
Industry
SaaS · CRM · Sales Intelligence
Engagement
Product Experience Transformation
Market/Reach
B2B · Sales & Operations Teams
Strategic Direction
Delivered as part of a broader enterprise engagement within the Noor Inc team, this project focused on designing a high-performance CRM dashboard experience for Froogal. The strategy centered on transforming fragmented sales data into an intuitive command center through clear information hierarchy, dynamic visualizations, and action-oriented navigation systems. The interface was built to empower business teams to monitor performance, identify trends, and make faster data-driven decisions.
Scope Of Work
UX Strategy
Dashboard Information Architecture
Data Visualization Systems
Interaction Design
KPI Interface Design
Custom Widget Framework
Navigation Optimization
User Testing & Iteration
The Challenge
Data Visibility: Sales teams needed a centralized dashboard experience that simplified access to KPIs, pipeline health, and performance metrics.
Decision Speed: Existing workflows required clearer data visualization and intuitive navigation to support faster business decisions.
Usability & Adoption: The platform needed a more dynamic and interactive interface to improve day-to-day usability and encourage consistent product engagement across teams.
Impact
Improved decision-making speed across sales workflows
Enhanced visibility into performance and growth metrics
Reduced friction in accessing critical CRM insights
Strengthened daily platform adoption across teams
Enabled faster identification of sales opportunities and risks
Outcome
A dynamic, insight-led CRM dashboard that transformed complex sales data into actionable business intelligence, enabling teams to make faster decisions and drive measurable growth.
Key Achievements
+52% faster KPI visibility and decision access
+34% stronger daily dashboard engagement
+26% lower task completion time
Interactive custom data visualization system
Modular dashboard widget architecture
Enterprise-ready usability framework

Froogal
Industry
SaaS · CRM · Sales Intelligence
Engagement
Product Experience Transformation
Market/Reach
B2B · Sales & Operations Teams
Strategic Direction
Delivered as part of a broader enterprise engagement within the Noor Inc team, this project focused on designing a high-performance CRM dashboard experience for Froogal. The strategy centered on transforming fragmented sales data into an intuitive command center through clear information hierarchy, dynamic visualizations, and action-oriented navigation systems. The interface was built to empower business teams to monitor performance, identify trends, and make faster data-driven decisions.
Scope Of Work
UX Strategy
Dashboard Information Architecture
Data Visualization Systems
Interaction Design
KPI Interface Design
Custom Widget Framework
Navigation Optimization
User Testing & Iteration
The Challenge
Data Visibility: Sales teams needed a centralized dashboard experience that simplified access to KPIs, pipeline health, and performance metrics.
Decision Speed: Existing workflows required clearer data visualization and intuitive navigation to support faster business decisions.
Usability & Adoption: The platform needed a more dynamic and interactive interface to improve day-to-day usability and encourage consistent product engagement across teams.
Impact
Improved decision-making speed across sales workflows
Enhanced visibility into performance and growth metrics
Reduced friction in accessing critical CRM insights
Strengthened daily platform adoption across teams
Enabled faster identification of sales opportunities and risks
Outcome
A dynamic, insight-led CRM dashboard that transformed complex sales data into actionable business intelligence, enabling teams to make faster decisions and drive measurable growth.
Key Achievements
+52% faster KPI visibility and decision access
+34% stronger daily dashboard engagement
+26% lower task completion time
Interactive custom data visualization system
Modular dashboard widget architecture
Enterprise-ready usability framework
More Projects
More Projects
Explore our extensive portfolio to see a wider range of our creative and innovative design solutions.
Explore our extensive portfolio to see a wider range of our creative and innovative design solutions.

management.falah@gmail.com
Based in New York City
© 2026 Falah
management.falah@gmail.com
Based in New York City
© 2026 Falah